"""
Compute the Q-transform of a batch of time-series data.
"""
from ml4gw.transforms import QScan
import matplotlib.pyplot as plt
import torch
sample_rate = 2048
duration = 10
# Output shape of the spectrogram
spectrogram_shape = [256, 256]
qscan = QScan(
sample_rate=sample_rate,
duration=duration,
spectrogram_shape=spectrogram_shape,
)
# Example data with shape (batch_size, channels, length)
X = torch.randn(10, 2, duration * sample_rate)
# Apply the Q-transform to compute the Q-transform of X
spectrograms = qscan(X)
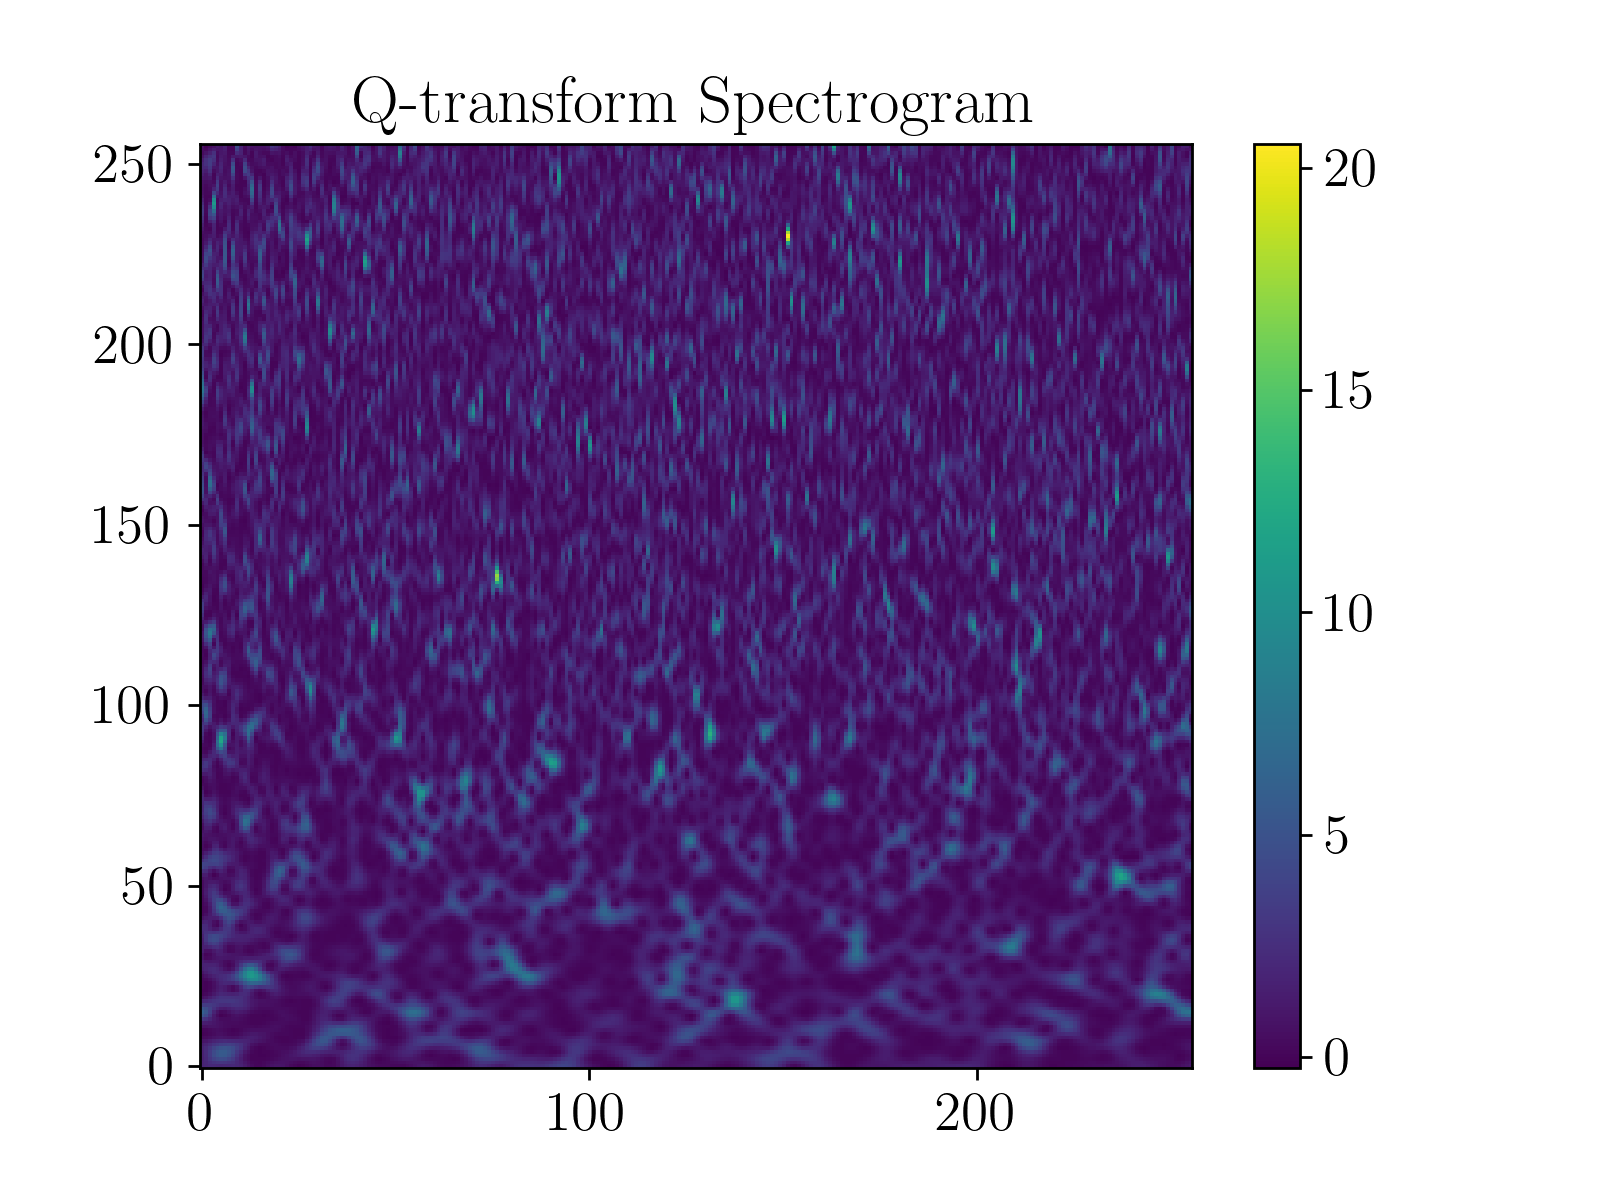
# Plot the first spectrogram
plt.imshow(spectrograms[0, 0], aspect='auto', origin='lower')
plt.colorbar()
plt.title('Q-transform Spectrogram')
plt.show()